Appendix Ι: Methodology
Introduction
Bibliometrics deal with the quantitative analysis of scientific literature and particularly with the analysis of citations that scientific publications receive within the international research community. Bibliometric indicators include publication and citation counts, scientific impact indices, collaboration degree, scientific fields of excellence etc.
Bibliometric analysis is a significant tool for the evaluation of research activity, for individual institutions as well as for national research systems or sectors. Bibliometrics offer a sound basis to measure the scientific output and performance, its international impact, the research networks among institutions and nations, the knowledge flows and links among scientific disciplines. The number of studies using bibliometric analysis is constantly growing at international level.
The present study consists part of a study series launched by the National Documentation Center (EKT).The study is based on bibliometrics to evaluate Greek scientific publishing activity at international level. Its first edition was published in 2010 under the title “Greek Scientific Publications 1993-2008: A bibliometric analysis of Greek publications in international scientific journals”. The study was widely used as a reference point by research institutions, universities and policy stakeholders.
The study’s third edition reviews Greek publications in international scientific journals for the 15-year period which extends from 2000 to 2014, highlights the trends and developments in the most recent years, namely after 2010. The study’s methodological design remains the same with the framework designed for the study’s first edition. The following paragraphs present the study’s methodological framework in detail:
Bibliometric Indicators
The study presents the following bibliometric indicators that are widely used throughout international literature:
- Number of publications
- Share (%) of publications
- Percentage (%) of cited publications
- Number of citations
- Share (%) of citations
- Citation impact
- Relative citation impact
- Field normalised citation score
- Number of highly cited publications (Top X%)
- Share (%) of highly cited publications (P Top X%)
For detailed information on bibliometric indicators and methods of their calculation see Annex II.
Bibliometric Databases
Web of Science (from Thomson Reuters), Scopus (from Elsevier) and Google Scholar are among the most well recognizable and internationally established publication and citation databases.
Google Scholar offers access to a huge number of digital sources including scientific articles, conference proceedings, reports etc. Nonetheless, it is not recommended for bibliometric analysis since it lacks detailed metadata necessary for the attribution of publications to research organisations, scientific fields or countries. In addition, it does not offer quality criteria for the inclusion of the different scientific items presented.
On the other hand, Web of Science and Scopus provide access to detailed metadata for publications which are published in scientific journals with well established selection criteria and peer review processes. The Web of Science provides data for more than 12.000 peer-reviewed journals. Its indexed records concern publications since 1900. Scopus, a more recent service, may index a continuously expanding range of journals with more than 18.500 titles, but citation analysis is available only for articles published after 1996. Both services, fail to fully cover certain scientific sub fields, especially those concerning the fields of “Social Sciences” and “Humanities”.
In order to maintain data consistency between the current and the previous study, it was decided to use the Web of Science databases. We intend, however to expand our data sources by including data from the Scopus database in a forthcoming version of the study.
More specifically, data was drawn from the following databases of Thomson Reuters:
- National Science Indicators (NSI): a database with publication and citation statistics for 194 countries and seven geopolitical regions, covering the thirty years between 1981 and 2010. Publications are divided into 253 fields. The information reflects the total number of publications and citations by country, year and scientific field. However, analysis per publication is not provided.
- InCites™ - Greece: a customized citation based research evaluation tool on the web. It uses publication and citation data from Thomson Reuters (http://incites.isiknowledge.com/), allowing for systematic and reliable analysis of Greek scientific publications. Within the framework of this study, the relevant data was processed in collaboration with Thomson Reuters so as to ensure consistency with NSI database.
Data for indicators related to the total number of Greek publications and their benchmark worldwide, was drawn from the NSI database. The Incites databases served as a source for data pertaining to indicators such as research collaborations, the distribution of publications by institution or category of institutions and by field of science.
Fields of Science
Both NSI and InCites allow for categorization of publications in 253 scientific subject fields. Both databases allocate each publication to a specific subject field according to the journal in which the publication appears in. It should be noted that a journal may be classified in more than one scientific subject field and so is the case for its publications.
The classification of Greek publications provided by Thomson Reuters databases, was used in this study for the calculation of bibliometric indicators such as field normalization citation score (normalization process). It is also used to present the specific subject fields where Greek institutions excelled.
Furthermore, Greek publications were classified into 6 major scientific fields and their 42 sub-fields, according to the revised version of the Frascati Manual of OECD. The Frascati classification scheme of fields of science and technology allowed for data comparability with standard practices at an international context. It also provided a more consistent framework for the identification of major fields of science in which Greek Institutions were active.
To this end, the 253 subject fields of the Thomson Reuters databases were mapped and included into the following major fields and sub-fields of science of the Frascati Manual:
- Natural Sciences (Mathematics / Computer and information sciences / Physical sciences / Chemical sciences / Earth and related environmental sciences / Biological sciences / Other natural sciences)
- Engineering & Technology (Civil engineering / Electrical engineering - electronic engineering - information engineering / Mechanical engineering / Chemical engineering / Materials engineering / Medical engineering / Environmental engineering / Environmental biotechnology / Industrial Biotechnology / Nano-technology / Other engineering and technologies)
- Medical & Health Sciences (Basic medicine / Clinical medicine / Health sciences / Health biotechnology / Other medical sciences )
- Agricultural Sciences (Agriculture, forestry, and fisheries / Animal and dairy science / Veterinary science / Agricultural biotechnology / Other agricultural sciences)
- Social Sciences (Psychology / Economics and business / Educational sciences / Sociology / Law / Political Science / Social and economic geography / Media and communications Other social sciences)
- Ηumanities (History and archaeology / Languages and literature / Philosophy, ethics and religion / Art (arts, history of arts, performing arts, music) / Other humanities)
The detailed mapping of the 253 subject fields of the Thomson Reuters databases with the 6major fields and 42 sub-fields of science of the Frascati Manual was provided in Annex III.
Institution Categories
Bibliometric indicators for Greek scientific publications were calculated at three different levels of aggregation:
- The total number of Greek publications
- Specific categories of institutions
- Inidvidual institutions.
| SECTOR | CATEGORY | ABBREVIATION | DESCRIPTION |
|---|---|---|---|
| Higher Education | Universities | Universities | Universities and Technical Universities, University Research Institutes (U.R.Ι.) and University Hospitals |
| Technological Education Institutes | ΤΕΙ | Technological Education Institutes | |
| Other Education Institutions | Other Education Institutions | Other Education Institutions include the Private Institutes of Vocational; Training (IEK) accredited by the Ministry of Education and Religious Affairs, as well as other HE schools/academies (e.g. Higher Ecclesiastical Schools, Military Academies). | |
| Research | Research centers supervised by the General Secretariat of Research and Technology | GSRT Research Centers | Research centers supervised by the General Secretariat of Research and Technology |
| Other Public Research Institutions | Other Public Research Institutions | Other Public Research Institutions supervised by various Ministries | |
| Health | Public Health Institutions | Public Health Institutions | Public Health Institutions of the national health system, hospitals, Institutions supervised by the Ministry of Health and Social Solidarity and Hospitals supervised by the Ministry of Defence |
| Private Health Institutions | Private Health Institutions | Private Institutions active in the health sector such as private hospitals, diagnostic centers, research centers etc. | |
| Other Public Institutions | Other Public Institutions | Ministries, Museums, Higher Military Education Institutions, Other Public Institutions and Public Enterprises | |
|
Other Private Institutions |
Other Private Institutions | Other Private Institutions such as Private Educational Institutions, Museums, Banks, non-profit organisations, non-governmental organisations and private enterprises | |
Annex IV provides the list of institutions examined in this study.
Data Processing
For the purpose of this study, EKT developed its own software which enables data cleaning and integrity check for WoS databases, calculation of non-trivial bibliometric indicators and presentation of the results using interactive visualizations.
Specifically, the software enables:
- calculation of complex bibliometric indicators such as the field normalised citation score per scientific field, the count and type of collaborations among institutions etc.
- classification of Greek publications adopting the Frascati/OECD taxonomy for scientific areas and mapping of the Frascati/OECD taxonomy with that employed by the Incites and NSI databases.
- production of analytical customized reports per institution category, per institution etc.
- effective cleaning of data and identification of Greek organizations. Cleaning the provided data was critical. The cleaning process allowed the export of reliable indicators since certain organizations appeared in the Incites database with multiple names and there was a lack of unique identifiers and authority files. The identification problem would pose difficulties when exporting reliable reports at organization level. By developing specialized software for this purpose – to resolve matters related with documentation and information organization- EKT implemented systematic procedures for cleaning the primary data. These procedures included identifying alternative names for Greek organizations and the homogenization of data -resulting in a new database version-. EKT’s previous bibliometric study, describes this procedure in detail.
- automated generation of interactive charts –embedded in the study’s online edition- so that the study’s results could be communicated in a comprehensive way.
The software developed by EKT employed a set of tools that allowed the processing of primary data of different types (XML, relational databases), their representation as an independent data model and their processing and categorization. The data model facilitated the calculation of descriptive and complex bibliometric indicators which were visualized using interactive charts and exported to multiple formats (CSV, Excel, JSON ) for use in different media (text files, spreadsheets).
Furthermore, the software was heavily parameterized, in order to allow parallel execution of different data workflows, which significantly accelerated the process of calculating the necessary indicators. Note that the system was designed to be largely independent of specific software and technologies, both in the incorporation of raw data and in the production of intermediate and final results.
Moreover, the system was developed with the aim to contribute to the automation of the production of bibliometric indicators calculated by EKT on a systematic basis, and to allow any update necessary for the calculation of new indicators. It also aimed to support the processing of primary data as extracted from a range of other databases (such as NCR including articles cited by Greek publications, Scopus etc.).
Finally, special attention was given to the presentation of Greek bibliometric indicators. Findings are presented in the form of an online book. The selected presentation format enhances accessibility and dissemination of the results and offers a range of navigation, interactive and browsing functions to its readers.
Types of publications
Throughout the international literature, the types of scientific publications studied -articles, research notes and reviews- are treated as the most important sources for knowledge production and science development. Also, the NSI database is based on these types of publications to provide summary descriptors for publications per country. Therefore, in this study we based on data related with articles, research notes and reviews and we excluded editorials, letters, correction notes and abstracts.
It is also important to note that in the field of natural sciences, the publication type “letter” corresponds to short articles with novel scientific results and usually high numbers of expected citations. When calculating bibliometric indicators, such “letters” are usually classified as publications or as research notes.. However, In the WoS databases the type “letter” refers to types of publications such as letters to the journals’ editors, letters including corrections or comments about past articles etc.
Year of publication
The distribution of publications across years is an important parameter in bibliometric analysis. Publications are commonly categorized according to the official date of their release in printed form. InCites database provides information for both the date of a publication’s official release as well as the date of its registration in the Web of Science system. However, in the case of the NSI database, publications across years are distributed according to the year of registration in WoS.
For reasons of data consistency, indicators were calculated according to information derived from both databases. it was therefore decided to treat the year of a publications’ registration in the WoS as the year of its publication. It should be noted that the publication date differs from the registration date in the WoS in about 18% of registrations on the Incites database.
Time frame for analysis of citations
The number of citations that a publication is likely to receive depends on its impact in the research community but also on the time period that has passed since it was first published. Older publications usually have more citations.
To normalize differences observed between high numbers of citations received by older publications and small in the latest publications, citation counting in this study was made using overlapping 5-year windows. Particularly, we recorded citations received in a certain 5-year period for publications edited within the same 5 year period.
As a result, trends in the number of citations and relevant bibliometric indicators were presented on the basis of 11 overlapping 5 year periods throughout the overall period of analysis (2000-2014).
Since the author’s practice of citing her/his previous work in a publication is a common practice among authors, we included self citations in the overall number of citations per publications.
Counting of publications
In most cases, publications have more than one authors. Their authors are likely to be affiliated with different institutions in different countries. In addition, the NSI and Incites database might classify a journal under more than one scientific fields. As a result, the distribution of publications into 6 major fields of science and their sub-fields, may cause overlapping. However, we should note that data analysis showed that 80% of publications were classified under a single scientific field.
Publication counts presented in this study are «whole counts» i.e. in the case of multi authored publications each participating institution or country got a whole count and not a fraction of the publication. Similarly, in the case of a publication classified in more than one scientific field, each scientific field or sub-field got a whole count of the publication. Whole counting was also followed in both NSI and Incites databases.
As a result, within a given frame of reference, the sum of publications compiled from different unit of analysis -institutions, institution categories or scientific fields –was higher than the actual total numbers of publications. The “share” (%) of publications of each analytical unit was calculated as the number of its publications divided by the actual total number of publications of the frame of reference and not by the sum of individual units. Consequently, “shares” express the participation of a given unit of analysis in the total output of its frame of reference and not its contribution to it. For example, a publication share of 80% for the institution category “Universities” means that in the 80% of Greek publications we record Universities as participating organizations.
The same rule applies when calculating the share (%) of citations and the share of scientific fields.
Finally, the same methodology is used for calculating the number of collaborations at national and international level. Collaboration is defined as co-authorship involving different institutions. International collaboration refers to Greek publications co-authored with institutions in another country (-ies). Exclusively international collaboration refers to Greek publications co-authored only with institutions in another country (-ies). National collaboration refers to Greek publications co-authored with Greek institutions. Exclusively national collaboration refers to Greek publications co-authored only with Greek institutions. No collaboration refers to Greek publications not involving co-authorship across institutions and includes articles either by only one author or articles being the product of intra-institutional collaboration.
Citation Impact Indicators
In bibliometric analysis, a range of indicators are used for evaluating the impact (or influence) of the published work on the scientific community. These indicators are principally based on the number of citations of publications for a specific time period.
The citation impact, –a widely used indicator-, is the average number of citations per publication. The indicator is calculated as the ratio of the number of citations recorded for a specific time period to the total number of publications of the same time period. The relative citation impact is used for comparative analysis of publications and compares the citations to publications per unit of analysis (e.g. Greece) in relation to the citations to publications within a certain frame of reference (e.g. OECD countries).The relative citation impact is calculated as the ratio of the corresponding citation impacts. When the value of the relative citation impact is greater than 1, the publications of the analysed unit have a greater impact than those within the reference frame.
A number of scientific studies have confirmed that factors such as the different citation practices in various scientific fields or the type of publication affect significantly the citation indicators.
Indeed, publication and citation practices vary among disciplines. There often exist differences between fields of research in terms of citation practices, the life-span of publications, publishing and citation patterns.
For instance, in medicine and molecular biology the annual publication output is high and the level of citations increases significantly within a relative short time period following the publication. On the contrary, in the Social Sciences the publication rate is rather low and many studies may still be cited decades after their release. In the Humanities, the greatest part of publications is books, monographs and articles usually published in national journals, which affects citation patterns. Other scientific areas, such as the ICT, have conference proceedings as their main publication source. Hence, comparison between indicators of different scientific fields and sub-fields may lead to misleading results.
To tackle the issue of different citation practices, it was decided to use the field normalised citation score, which is an incremental improvement of the Crown indicator.
The field normalised citation score or citation score is the key indicator used in this study to estimate the impact of the publications of the analytical units examined (e.g. institution category, institution, subject filed etc) in relation to the world. The field normalised citation score was calculated using software developed by the National Documentation Center (EKT) allowing for calculations at the level of each publication for each of the 253 subject fields provided by NSI and InCites databases.
More specifically, the number of citations of each of the unit’s publications is normalised by dividing it with the world average of citations to publications of the same publication year and subject field. The citation score is the mean value of all normalised citation scores for the unit’s publications. As an example, the citation score of the institution category “Universities” was the mean value of the citation scores calculated for each of the Universities publications; the citation score of each publication was represented by its citations divided by the world average of citations to publications of the same publication year and the subject field it belonged to.
Finally, another important issue in the calculation of citation impact was the skewed distribution of citations. In many cases, within a given number of publications, a few publications were disproportionately highly cited while a large proportion had only few or no citations at all. This distribution would differ significantly per case (e.g. for scientific fields or institutions). The issue of skewed distribution of citations is not adequately addressed by the common bibliometric indicators. An interesting approach is the logarithm-based citation z-score, which takes both the citation rate variability of different fields into account as well as the skewed distribution of citations over publications. However, this indicator is rather complicated and was not used in this study since it was not possible to calculate it from Incites and NSI databases.
In this study, we present highly cited publications using indicators for the number (P Top X%) and percentile (Top X%) of publications that were ranked worldwide in the 1%, 5%, 10%, 25% and 50% most cited publications by publication year and scientific field. These indicators were used complementary to the field normalised citation score (citation score).
Rate of Change
Results regarding the bibliometric indicators throughout the period 1996-2010 were displayed either on an annual basis or within rolling 5-year periods.
The progression and growth for indicators was evaluated using the rate of change determined as follows:
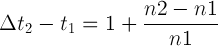
where
 is the rate of change
n1, n2 are the values of the indicator for the years (or period of years) t1 and t2, respectively.
The indicator is equal to 1 if the values n1, n2 remain the same for the years (or period of years) t1 and t2.
Least number of publications
Field normalised citation scores were calculated per institution, institution category or scientific field only in the case of a “considerable” number of publications i.e. a number that would ensure the reliability of analysis and minimize the influence of random factors without excluding from the analysis organizations with a rather low publications output. Data analysis showed that a threshold of 75 (ορ 50) publications for the period 2000-2014, corresponding to 5 publications per year, constituted a good compromise. Given the low number of publications by Greek institutions in most of the cases, the above threshold aims to ensure the reliability of information about the majority of institutions.
Interpretation of results
The study’s aim was to provide reliable bibliometric data, an important source of information for the Greek research landscape. Along with the indicators used, there exists a wide range of indicators for the measurement of research activity -such as the number of patents, licenses, research projects, social impact etc-. Within this range, bibliometric indicators are among the most significant metrics.
However, to avoid fragmented and invalid comparisons, a combined interpretation of bibliometric indicators is required on the part of the reader. Hence, when interpreting indicators such as the rate of change, the relative citation impact or citation score, the percentage of cited publications or the percentile breakdown of highly cited publications, one has to also consider the number of publications as well as their systematic production over time.
The overall aim of the analysis carried out, was not just to identify trends and tendencies but also to highlight outstanding aspects which characterize the output of Greek publications. To this end, we applied a wide range of indicators to compile a comprehensive picture. In order to minimize the influence of random factors, we had to make the following choices and decisions:
- To reflect information regarding current research activity, figures present information and indicators corresponding to the last 5-year period 2010-2014 so that to control abnormal annual variations.
- We provide a trend analysis, when applicable, throughout the period 2000-2014.
- To ensure the reliability of results, indicators were calculated only for institutions with a publication output above the threshold (75 publications for the period 2000-2014).
- The calculations did not take into account certain extremely random cases. For example, when calculating citation scores per scientific subfields we excluded extremely highly cited publications produced by institutions with low and unstable number of publications in the field.
- Finally, the study involved a robust infrastructure and appropriate software tools, which will support future bibliometric studies, part of the series. By ensuring consistency in procedures, methodology and software used, we make possible the accurate mapping of research activity for each given period and we may enable comparisons across data.
At last, we should mention that the average number of publications per researcher or per full time equivalent is an indicator widely used in comparative evaluation of research activity of institutions. This indicator allows comparisons in terms of “productivity” and gives more reliable results regarding each institution’s performance. Since there was a lack of data about the country’s base of researchers, the study presents indicators regarding the volume of publications per institution or institution category which cannot be used as a measure for the evaluation of institutional performance/productivity.